


KEY FIGURES 20241
Revenue in CHF
Smiles impacted3
Employees
Organic revenue growth
Employee engagement score
Women in leadership positions4
Core EBIT margin
Learning and growth score
Educational activities in low- and middle-income countries
Dividend2 per share in CHF
Renewable energy
GHG emissions compared to 2021 (Scope 1+2) t CO2e
1 Figures refer to continuing operations, following the agreement signed in August 2024 to sell the Group’s DrSmile business to Impress Group, which was subsequently completed in September 2024.
2 Subject to AGM approval
3 1 ortho case sold = 1 smile and 2 implants sold = 1 smile
4 According to new calculation methodology
Letter from the Chair and CEO

Petra Rumpf, Chair and Guillaume Daniellot, Chief Executive Officer
Dear Reader,
In 2024, we once again performed and transformed, continuing our journey to become the most customercentric and innovative oral care company. We achieved exceptional results, driven by the dedication and passion of our teams, the loyalty of our customers, and the trust of our shareholders.
“6.7 million smiles helped in 2024, 1.1 million more than last year.”
Read more

“We don’t have the fear of failure (…). We can dare to try. We can be bold because we really have this passion for learning, the agility, the entrepreneurial mindset, the psychological safety… And in my opinion, this makes us unstoppable.”
Daniela Felipucci, Head of Strategic Projects Medical Education
Performance by region1
North America (NAM)
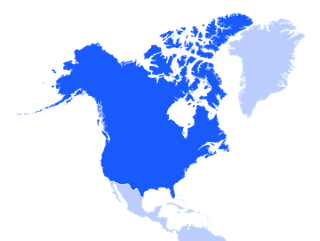
Revenue in CHF
+3.6% organic revenue
of Group revenue
+1.2% change in CHF
Europe, Middle East, Africa (EMEA)
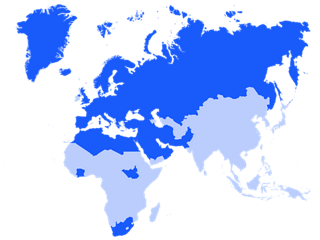
Revenue in CHF
+11.3% organic revenue
of Group revenue
+9.0% change in CHF
Latin America (LATAM)
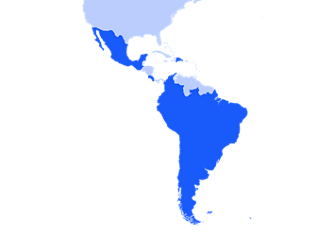
Revenue in CHF
+15.6% organic revenue
of Group revenue
+4.3% change in CHF
Asia Pacific (APAC)
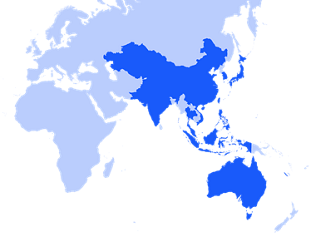
Revenue in CHF
+33.3% organic revenue
of Group revenue
+27.7% change in CHF
1 Figures refer to continuing operations, following the agreement signed in August 2024 to sell the Group’s DrSmile business to Impress Group; the sale was completed in September 2024.
In the financial year 2024, we achieved revenue of CHF 2.5 billion and organic revenue growth of 13.7%, or 10.0% growth in Swiss francs after currency headwinds.
Innovation and execution defined 2024 as a standout year for the Group. Advancements in implantology, orthodontics and digital solutions reinforced our position as a leader in dental care in a growing market. The overall addressable market across all business areas grew from CHF 19 billion in 2023 to about CHF 20 billion in 2024.
Our implantology business achieved double-digit revenue growth in both the premium and challenger segments, contributing to the strong 2024 performance. Consequently the Group estimates that its market share in implantology has grown from approximately 32% to 35%. The ClearCorrect and digital solutions businesses also grew double-digit globally, contributing to the strong performance and solidifying the Group’s market position.
Alongside its focus on innovation, execution and organic growth, the Group continued to make significant investments in production capacity, digital transformation and the development of its workforce. Strong top line growth combined with those continued investments translated into an EBIT margin of 27.6% at constant 2023 currency exchange rates .
Despite persistent macroeconomic uncertainties, we continued to make a meaningful global impact, helping 5.6 million smiles in 2023 and growing to 6.7 million smiles in 2024.
Key performance figures1
| 2024 Core2 |
2023 Core2 |
|
| Revenue (CHF m) | 2 503.9 | 2276.7 |
| Gross profit margin (%) | 71.4 | 74.5 |
| EBIT margin (%) | 26.0 | 28.0 |
| Net profit margin (%) | 20.0 | 21.2 |
1 Figures refer to continuing operations following the agreement signed in August 2024 to sell the Group’s DrSmile business to Impress Group; the sale was completed in September 2024.
2 To facilitate a like-for-like comparison, the Group presents ‘core’ results in addition to the results reported under IFRS Accounting Standards.
| The Business development includes the following chapters |
|---|
| Business performance |
| Share performance |
Renewable electricity at our own manufacturing
Of leadership positions held by women1
Learning and growth score
Greenhouse gas emissions
Scope 1
Educational activities in low- and middle-income countries
Sales compliance e-training mean completion rate
Smiles helped
Greenhouse gas emissions
Scope 22
1 Based on new calculation methodology
2 Market-based emissions
| The Sustainability report includes the following chapters |
|---|
| Letter from the Chair of the Audit and Risk Committee |
| Introduction |
| Advancing oral care |
| Empowering people |
| Caring for the planet and society |
| Acting with responsibility |
Corporate governance report
The principles, structures, mechanisms and controls by which the Straumann Group is directed and the people who are responsible for their execution.
Compensation report
This report provides a comprehensive overview of the Straumann Group’s compensation principles, practices and delivery framework. It also provides information on the compensation of the general staff, management, Executive Management Board (EMB) and Board of Directors (BoD).
Financial report
The consolidated financial statements of the Straumann Group for the year ended 31 December 2024 were authorized for issue in accordance with a resolution of the Board of Directors on 17 February 2025 and are subject to approval by the annual general meeting on 10 April 2025.